5 Tips for Easily Creating an Awesome Scientific Illustration
Claudia Polese, Ph.D. | Jan. 12, 2017
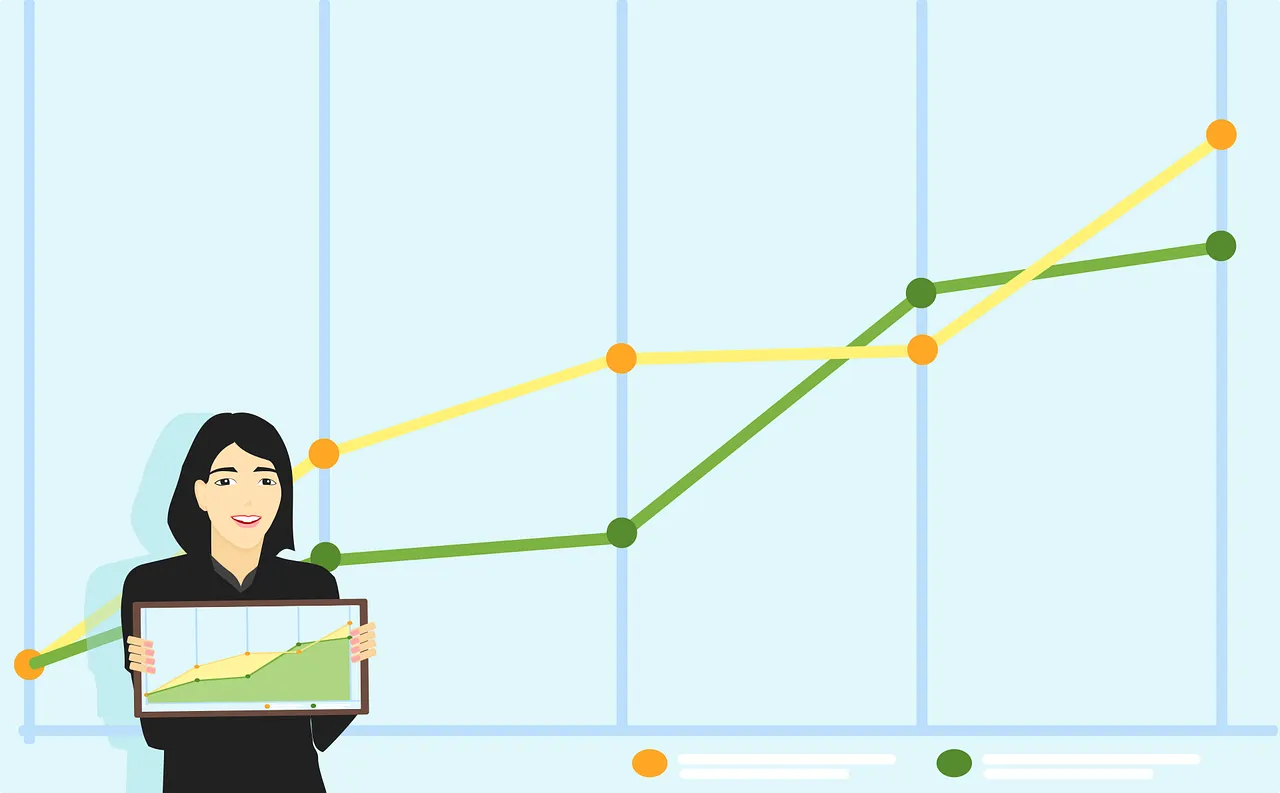
A picture is worth a thousand words …
This statement is valid even for scientific research. Sure, the importance of an exhaustive paper that includes valid data supporting your study is undeniable. However, nothing works better than an awesome scientific illustration to capture the attention of your fellow academics and students and to effectively communicate your results.
Many researchers put all their efforts into writing their results in a paper to make it acceptable for reviewers, and often they do not pay proper attention to their illustrations or are discouraged by a lack of artistic skills. However, you don’t need to be an artist to make an awesome scientific illustration, if you follow a few simple tips.
1. Consider your target audience and the context
A unique scientific illustration can be amazing, but it needs to work well for your specific purpose.
When making scientific figures, you must consider the audience you are addressing, precisely as you do when writing the content of the manuscript. If the illustration is for other scholars reading your manuscript, it must look professional and accurate. However, often, an audience of students or potential funding managers requires an immediate and captivating style to catch their attention quickly, especially in the venue of symposiums or conferences.
The same consideration should be given to the destination of the illustrations itself. If the figures will be incorporated in publications, such as books or scientific papers, then their task is supporting the text, not substituting it. Instead, conference presentations benefit from a more visual approach, including visual abstracts and videos, and the images can even replace the text. Figures on conference posters must both capture the participants’ attention as they walking through the panels and effectively support your results when the participants begin to read your poster.
TOC images, visual abstracts, and interesting poster figures are fundamental for capturing the eye of the academic community in the wide sea of scientific production. Then, your illustration must also satisfy their deep examination.
Receive Free Grammar and Publishing Tips via Email
2. Make a sketch first
When beginning to write a new paper, first, you have to focus on what you want to communicate, establish a logical order, and put down a draft.
The same thing must be done for a scientific illustration. What information do you want to provide? If you need infographics, workflows, or experimental layouts, it is important to make some sketches first to determine how to organize the various sections.
With regards to technical graphs that report experimental data, you can take notes first on a cold software-produced diagram to see how you could better show the results and to avoid confusion.
3. Be clear and simple, but not superficial
Unlike other artistic contents, a scientific illustration should be as clear and simple as possible without unnecessary esthetic details.
You must help your audience understand the scientific concepts and experimental results that are not always easy to explain to avoid further confusion.
Simplicity does not mean superficiality: the details you choose to put in your illustration must always be correct. The esthetic of the illustration is important, but its scientific accuracy comes first.
Also, the color palette must be simple and should not include a multitude of brilliant tones. A B&W image can be sufficient in many cases, but sometimes the use of colors can help distinguish the data shown in complex graphs. Just remember to consider using colors that can be easily distinguished by color-blind individuals.
4. Use proper software
As for every other activity, the proper tools must be used.
Occasionally, a simple hand sketch is enough such as for biological illustrations. More often, a digital tool is necessary, but you have to choose the proper one. If you just need infographics or workflows, a simple presentation software or a vector design program will be sufficient. In other cases, a 3D layout will be necessary to illustrate your experimental setup because it can efficiently replace photos of the instrumentation.
And remember to choose the proper image resolution…(check your journal’s guidelines).
5. Support the figure with text or an oral explanation when necessary
Although the illustration is important, do not neglect the supporting text (if required).
Figures for an academic book or a paper need a proper legend or labelling and must be accompanied by a clear figure caption, and the combination of images and text must be organic.
When giving a scientific talk using an illustration and when you are standing in front of the audience, you cannot just show your awesome illustration and stand mute. You must explain the work that refers to your visual support. Thus, a good oral explanation is key to getting your point across.
And remember, the most important thing to make a great scientific illustration is to clearly know what you want to communicate!
For further reading:
Buriak, J. (2011) Summarize Your Work in 100 Milliseconds or Less...The Importance of the Table of Contents Image . ACS Nano 5 (10): 7687-7689. doi: 10.1021/nn203713e
Buriak, J., ed. (2014) Titles and Table of Contents Images: The Candy Store Analogy . Chemistry of Materials 26 (3), 1289–1290. doi: 10.1021/cm500170v
Gustavii, Björn. (2008) How to Write and Illustrate a Scientific Paper , 2nd ed. New York: Cambridge University Press. doi: 10.1017/CBO9780511808272
Hodges, Elaine R S., ed. (2003) The Guild Handbook of Scientific Illustration , 2nd ed. Hoboken, N.J.: John Wiley. ISBN: 978-0-471-36011-7
You may also like these articles:
5 Golden Rules for Writing an Abstract
6 Tips for Choosing Keywords for Your Scientific Manuscript
11 Tips for Impressing the Journal Editor with Your Cover Letter
If you need help developing your scientific illustration, even from a basic hand-written sketch, consider Falcon Scientific Editing’s illustration services . We are here to help you make the most of your figures, tables, TOC images, conference illustrations, and visual abstracts! You are also welcome to view a sample of our illustration work .
Comments or Suggestions?
Complete our Blog Feedback Survey and Receive 10% Off Your Next Order!
About the Author:

Dr. Claudia Polese has a Ph.D. in Chemical and Materials Engineering from the University of Rome “La Sapienza” with expertise in X-Ray Spectrometry and Conservation Science for Cultural Heritage. During her academic career, she redacted several scientific papers and research projects and revised various manuscripts. Contemporarily, she developed her passion for art and graphic design. Presently, she is a freelance scientific writer and illustrator.
Topics : Illustrations